Using SSIS to generate PivotViewer CXML from SSAS
I completely forgot but a few months ago I put together an SSIS package to generate CXML from a cube in a way very similar to how PivotViewer for Reporting Services generates its tiles - only without SharePoint.
When designing the SSIS package I really wanted to make it configurable so that it can be easily adapted to work from any cube source. Hence there are a few design decisions that may seem a little odd - more on that later.
My example cube is based on a blog site I scraped and so has some familiar dimensions - News and Terms (Tags) with the measures being a count of news items and terms. Below is how to package has been put together.
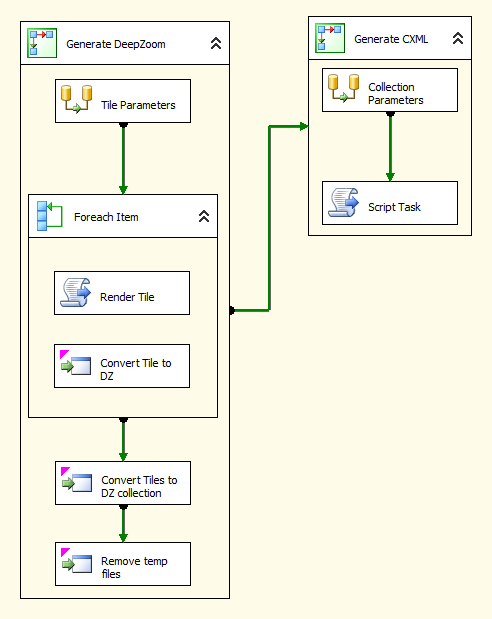
As you can see the solution is in two core steps. The first is to generate the DeepZoom images and the second is to create the CXML.
Generating the images requires the unique identifier of each item to appear in the collection, then passing that identifier as a parameter to a Reporting Services report to render the tile as an image. As my data is based on a cube I use the following query to get a list of the items:
SELECT [[News]].[News]].[News]].[MEMBER_UNIQUE_NAME]]] as [Items]
FROM OPENROWSET('MSOLAP',
	'DATASOURCE=.; Initial Catalog=BizCube;',
	'select
		non empty{[Measures].[News Count]} on 0,
		non empty{
			([News].[News].[News].members,
			[Terms].[Term].[Term].members)
		} DIMENSION PROPERTIES MEMBER_UNIQUE_NAME on 1 from [Biz]')
As mentioned making it flexible means that I’ve had to make some design decisions, which means using the SQL OPENROWSET to query the cube from a SQL instance. The main reason for this is to have a consistent alias for the returned column - in this case [Items], which then means the data flow path does not need to change as it’s always expecting a column called [Items]. The result of the query gives me results in the form “[News].[News].&[395]” where the identifier can easily be extracted. I then have a script task to query the report passing the identifier as a parameter and specifying the report be rendered as a png which can then be downloaded. Once downloaded the image is then fed into the DeepZoom DZConvert.exe tool to create the tile.
The next step is to create the CXML. This is done by querying the cube again but this time returning all the facets that I want to use in the Pivot collection. The query looks like this:
select 'Key:key|Title:String|Caption:String|Url:link|Term:String|Term Count:Number' as [Items] union all
select
	cast([[News]].[News]].[News]].[MEMBER_UNIQUE_NAME]]] as varchar(255)) + '|' +
	cast([[News]].[News]].[News]].[MEMBER_CAPTION]]] as varchar(255)) + '|' +
	cast([[News]].[Caption]].[Caption]].[MEMBER_CAPTION]]] as varchar(255)) + '|'+
	cast([[News]].[Post Url]].[Post Url]].[MEMBER_CAPTION]]] as varchar(255)) + '|'+
	cast([[Terms]].[Term]].[Term]].[MEMBER_CAPTION]]] as varchar(255)) + '|'+
	cast([[Measures]].[News Terms Count]]] as varchar(255)) + '|' as [Items]
from OPENROWSET('MSOLAP', 'DATASOURCE=.; Initial Catalog=BizCube;',
	'select non empty{
		[Measures].[News Terms Count]
	} on 0,
	non empty{(
		[News].[News].[News].members,
		[News].[Caption].[Caption].members,
		[News].[Post Url].[Post Url].members,
		[Terms].[Term].[Term].members
	)}
	DIMENSION PROPERTIES MEMBER_CAPTION, MEMBER_UNIQUE_NAME, MEMBER_KEY on 1 from [Biz]')
The query consists of two parts, the first creates a ‘|’ delimited list of key/value pairs of the facet name and its type - this is used to construct the FacetCategories section of the CXML. The second part queries the cube for the corresponding FacetCategory values and delimits them with a ‘|’. Again like the previous query it’s done using OPENROWSET in order to alias the column as [Items].
The result of the query is then passed to a script task where the CXML is generated. To make it even easier the both queries are generated via variables, so changing cube sources should only be a matter of updating the values and hitting execute!
The solution can be downloaded from here (37KB zip) so please let me know what you think!
Also stay tuned as I’m planning on putting together a series of posts on how we built pivot.lobsterpot.com.au (finally!)