Power View - how it works: part 1
I’ve been meaning to check out Power View for a while now but with getting ready for my PASS Summit 2012 talk and PivotViewer (more on that soon) I haven’t had much spare time to dig deep into it.
Since I first saw it I was curious to know why it had so many dependencies - SharePoint 2010 (Enterprise), SSRS and SSAS, and how all those different systems are used to coordinate the rendering of a Power View report.
I’ve broken this little investigation up into a series of three posts which which I will cover:
-
What is a Power View report and how does it fit with SharePoint, SSAS, SSRS and Sliverlight (this post).
-
How to create a standalone version of Power View (without SharePoint and Reporting Services)
What is an .rdlx?
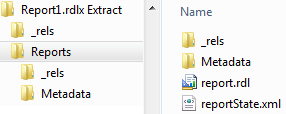
Power View reports are based on a .rdlx file which is generated by SharePoint when you create a new Power View report. If you are interested in what makes up the internals of an .rdlx file then Dan English (blog | twitter) has already cracked one open - http://denglishbi.wordpress.com/2012/06/12/inside-the-power-view-rdlx.
As Dan discovers Power View reports are based on an .rdl file like Reporting Services, but with a slightly different xml schema. The .rdl file is then wrapped in a .zip file with the extension .rdlx - just like all the other office document files (as they are all based on the Open XML standard).
However if you are curious enough to try and run the .rdl file that is inside the Power View report in BIDS/SSDT you’ll be greeted with an error saying something like “The report definition is not valid or supported by this version of Reporting Services”.
If you are not aware Power View reports are rendered by a Sliverlight application called Microsoft.Reporting.AdHoc.Shell.Bootstrapper.xap which comes in two flavours - one for SharePoint (version 11.0.2100.60), and another for Excel 2013 (version 11.0.2809.6). The Sliverlight control that hosts Power View in SharePoint takes two key initialisation parameters. The first is ItemPath which is the path to the Power View .rdlx file on SharePoint. The second ReportServerUri is the path to the Reporting Services web service - located at /_vti_bin/reportserver/. There are a few other parameters but those two are the most important.
Loading a Power View report
When a Power View report is first requested it sends a request to the SSRS web service with the path to the .rdlx file (specified in the ItemPath parameter) and an rs:command parameter of GetReportAndModels. A typical first request would look something like this (parameters are URL encoded):
http://intranet/_vti_bin/reportserver/?http%3A%2F%2Fintranet%2FPowerPivot%20Gallery%2FReport.rdlx&rs:Command=GetReportAndModels
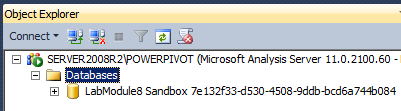
Reporting services then signals to SharePoint that the PowerPivot mode has been requested and then streams the model into the Analysis Services instance (in SharePoint integrated mode). SharePoint does this basically because it doesn’t understand what a tabular model is, and because Analysis Services is much better a processing and distributing the query load. What’s interesting about the relationship that SharePoint has with SSAS is that it’s only a temporary model, once it’s no longer in use a SharePoint timer process will come along and remove it from SSAS (which is why it gets such a horrible name).
The reporting services web service then returns a response to Power View, it’s contents contain two parts - the binary .rdlx file and an xml document. The xml document contains all the data source connection details from the Power View report which (I assume) is so Power View can start requesting the datasets in one thread while it extracts the contents of the .rdlx and builds the UI in the other. This is what’s happening when you see this kind of behaviour:
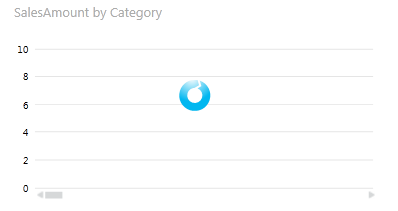
Power View has finished rendering the report UI and is waiting for the asynchronous request to come back for the actual dataset.
Dataset requests use a different command of rs:RenderEdit, along with the current session id. Once the request had been processed the reporting services web service then sends a binary response which contains the requested dataset back. A typical request looks like the following:
http://intranet/_vti_bin/reportserver/?rs:Command=RenderEdit&rs:ProgressiveSessionId=fe51a94b919c421380a57093caecb725y0y1yb552ckd2dbjqmmhpy45
In the next post I’m going to show how I’ve been able to host a Power View report outside of SharePoint and Reporting Services.