SVG templates for data bound graphics
One of the most frequent questions I get about the HTML5 PivotViewer is how to create data bound HTML templates, styled with CSS. Invariably the answer is that it cannot be done due to the nature of the HTML5 canvas element, however there is an alternative.
Early on when building the HTML5 PivotViewer I was faced with a technical decision of how I was going to display and animate up to several thousand images at once without affecting performance - especially on a mobile device. Ultimately there were three choices either plain ol’ HTML like Isotope, SVG based like D3 or the canvas. In the end I chose the canvas which provided the best performance and support for raster images (Deep Zoom for backwards compatibility and large image support).
While the canvas element was the best choice it presents a problem of how to easily create and style a template that can then be converted into a raster image using only JavaScript. The solution I’m going to demonstrate is to use SVG.
What is SVG?
If you’re not familiar with SVG it’s a vector image format that is defined with XML. This means that it’s possible to create vector images with a just a text editor! If you don’t find generating images from text very intuitive there are also plenty of tools available for creating SVG images, I’d recommend Inkscape as a solid and free choice.
One of the huge benefits of using SVG is that it’s just XML and therefore possible generate an SVG image using code. With a little jQuery it’s as simple as:
$('#svgContainer').append(
  '<svg xmlns="http://www.w3.org/2000/svg">' +
  '<circle cx="50" cy="50" r="25" stroke="none" />' +
  '</svg>'
);
SVG templates with ICanHaz.js
While this is ok for simple examples, creating elements using string concatenation is messy and difficult to maintain. Instead I like to use a little library called ICanHaz.js which uses Mustache syntax for data binding to a template. I’ve been using ICanHaz.js for a while now to create templates for all the PivotViewer UI. It provides a much cleaner separation of the UI from the code and has a simple syntax. To demonstrate I’ve got to two examples.
For the first example I’m going to create a simple SVG chart with which I can bind my chart data. The SVG template with Mustache tags is below:
<script type="text/html" id="svgTemplate">
  <svg xmlns="http://www.w3.org/2000/svg">
    <g id="chart">
      <path d="m10 10 V10 210 H10 210" stroke="#000" stroke-width="1px" fill="none"/>
      <text x="220" y="20" fill="black">Legend</text>

      <text x="220" y="" fill="black"></text>
      <rect x="280" y="" transform="translate(0,-13)" width="15" height="15" fill="" />

    </g>
    <g id="data">

      <g id="series-" fill="">

        <circle cx="" cy="" r="2" stroke="none" />

      </g>

    </g>
  <svg>
</script>
Here I’ve got the SVG template wrapped in a SCRIPT tag with a type of text/html. There are a few SVG elements but the real power is the extra Mustache tags. There are two key tag types in the example, the ** and ** define a repeating section and the ** and ** tags correspond to properties in my data set.
Now that I’ve defined the temaplte I can then use ICanHaz.js to grab the template and apply the data in the chartData object.
$(document).ready(function() {
  var $container = $('#svgContainer');

  var chartData = {
    series: [
	  {
      name: 'Series 1',
      colour: 'red',
      ypos: 50,
      data: [
	    { xAxis: 125, yAxis: 60},
		{ xAxis: 15, yAxis: 177},
		{ xAxis: 33, yAxis: 105}]
      },
      {
      name: 'Series 2',
      colour: 'blue',
      ypos: 70,
      data: [
	    { xAxis: 44, yAxis: 60},
		{ xAxis: 66, yAxis: 77},
		{ xAxis: 130, yAxis: 130}]
      }
    ]
  };

  var template = ich.svgTemplate(chartData);
  $container.append(template);
});
The chartData object contains two series, each containing an array called data (remember ** and **) that contains each of the points xAxis and yAxis. In the code above the key line is:
var template = ich.svgTemplate(chartData);
Which is where the chartData is bound to the svgTemplate. If we run the example in a browser we should see the following:
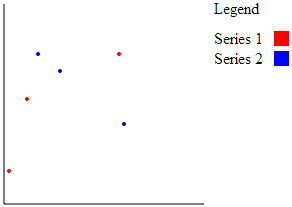
While this is a simple example, and the chart still needs a little work before I would be happy to put it into produciton, it does demonstrate the potential power and speed of templating with SVG.
SVG templates and the canvas
Once we’ve got a data bound template the next step is to convert the XML in the SVG image into canvas draw methods. This time I’m going to rely on the excellent 3rd party library canvg to do the heavy lifting. It’s constructor accepts the SVG and the id of a canvas element. It then parses the SVG and draws it onto canvas - simple!
The following SVG template is a simplified version of the PASS Summit 2012 tiles I’ve created in a previous collection, without the speaker images.
<svg xmlns="http://www.w3.org/2000/svg">
  <defs>
    <linearGradient id="grad1" x1="0%" y1="0%" x2="100%" y2="0%">
      <stop offset="0%" stop-color="#C3381B" />
      <stop offset="14%" stop-color="#F68D29" />
      <stop offset="28%" stop-color="#E1B524" />
      <stop offset="42%" stop-color="#87A63F" />
      <stop offset="56%" stop-color="#2A854F" />
      <stop offset="70%" stop-color="#266B8F" />
      <stop offset="100%" stop-color="#1C4161" />
    </linearGradient>
  </defs>
  <rect x="0" y="0" rx="10" ry="10" width="256" height="256" stroke="none" fill="" />
  <rect x="16" y="16" rx="10" ry="10" width="224" height="224" stroke="none" fill="#000" />
  <rect x="24" y="168" rx="10" ry="10" width="208" height="64" stroke="none" fill="#fff" />
  <circle cx="128" cy="100" r="40" stroke="url(#grad1)" stroke-width="30" fill="none"/>

  <text x="30" y="" style="font-family: arial; font-size: 11px;"></text>

</svg>
I can then dynamically create a canvas element, use canvg to apply the data bound SVG to the canvas, cache the canvas element in an array and then remove the canvas from the DOM. In this example I’m using the JavaScript implementation of Mustache as I don’t need all the functionality that ICanHaz.js provides.
if (!this._items[item.Img]) {
  var borderColour = GetColour(item.Facets["Category"][0].Value);
  //attach a canvas to the DOM
  $('#pivotviewer')
    .after("<canvas id='" + item.Id + "' width='256' height='256'></canvas>");
  var data = {
    Category: borderColour,
	//TODO: implment word breaker.
    Title: [ { Text: item.Name, ypos: 190 } ]
  };
  //use Mustache to bind the data to the template
  var databound = Mustache.render(this.template, data);
  //use canvg to convert the SVG to canvas methods
  canvg(item.Id, databound);
  //cache canvas
  var canvas = $('#' + item.Id);
  this._items[item.Img] = canvas[0];
  canvas.remove(); //once cached remove it from the DOM
}
 You can see it all in action here: http://pivot.lobsterpot.com.au/json.htm. this collection is based on a JSON data source, with the newly added Spatial type (see Locations for an interactive map).